
.
A recent rapid decline in its money supply highlights deflationary concerns in China. The GDP deflator, a broad, inflation-adjusted measure of economic output, has been negative for five consecutive quarters. Judging by recent experiences in the United States and Japan, China will be challenged in its efforts to lift barely positive consumer inflation closer to the People’s Bank of China’s 3% target.
Grappling with a property-driven slowdown, China has introduced several stimulative measures this year. Most have been aimed at the supply side.
“Policy aimed at stoking demand to boost confidence among China’s consumers is likely required in addition to the supply-side measures,” said Grant Feng, a Vanguard senior economist who studies the Asia-Pacific region. “People won’t spend on goods and services if they expect that prices will be lower next month. That would mean further downward pressure on prices and a harder road back toward potential growth.”
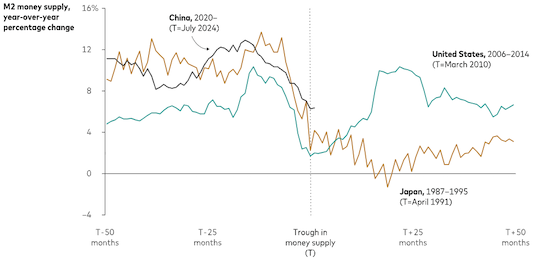
Notes: “T” represents a trough in M2 money in circulation. Increments before and after the troughs are in months. M2 is a broad measure of money in circulation that includes all aspects of M1 (such as physical currency and checking and savings accounts) plus other highly liquid assets such as certificates of deposit and money market accounts.
Sources: Vanguard calculations, based on data from CEIC Data through July 31, 2024.
Our chart reflects a relatively swift return to previous M2 money-in-circulation levels in the United States following the global financial crisis, which was aided by timely consumer-focused stimulus. “A quick and decisive policy response is critical to fighting deflationary risk,” said Qian Wang, Vanguard chief economist for the Asia-Pacific region. “The U.S. after the global financial crisis offers a good example of this, whereas Japan in the 1980s and 1990s lacked a swift and sufficient response. There is a good lesson for China in these experiences.”
Outlook for financial markets
Our 10-year annualised nominal return and volatility forecasts are shown below. They are based on the 30 June, 2024, running of the Vanguard Capital Markets Model® (VCMM). Equity returns reflect a range of 2 percentage points around the 50th percentile of the distribution of probable outcomes. Fixed income returns reflect a 1-point range around the 50th percentile. More extreme returns are possible.
Australian dollar investors
Australian equities: 4.7%–6.7% (21.7% median volatility)
Global equities ex-Australia (unhedged): 4.3%–6.3% (19.1%)
Australian aggregate bonds: 4.1%–5.1% (5.6%)
Global bonds ex-Australia (hedged): 4.3%–5.3% (4.9%)
Notes: These probabilistic return assumptions depend on current market conditions and, as such, may change over time.
Source: Vanguard Investment Strategy Group.
IMPORTANT: The projections or other information generated by the Vanguard Capital Markets Model regarding the likelihood of various investment outcomes are hypothetical in nature, do not reflect actual investment results, and are not guarantees of future results. Distribution of return outcomes from the VCMM are derived from 10,000 simulations for each modelled asset class. Simulations are as of 31 May, 2024. Results from the model may vary with each use and over time.
Region-by-region outlook
The views below are those of the global economics and markets team of Vanguard Investment Strategy Group as of September 19, 2024.
United States
The Federal Reserve cut its policy interest rate by 0.5 percentage point on 18 September, to a range of 4.75%–5%, but did so in the context of economic resilience rather than concerns about a material slowdown. We expect:
- Economic growth to cool but remain at a near-trend pace of 2% by year-end.
- The pace of core inflation, measured by the Fed’s preferred gauge, personal consumption expenditures, to rise by year-end to 2.9% on a year-over-year basis, because of base effects, or challenging comparisons with year-earlier data.
- The unemployment rate ending the year marginally above current levels. It measured 4.2% in August.
Australia
The economy is growing at its slowest pace in decades, but inflation that is falling only gradually is likely to keep the central bank from cutting its policy interest rate this year. We expect:
- Full-year economic growth of about 1%.
- The unemployment rate to rise to about 4.6% by year-end amid elevated interest rates. It was 4.2% in August.
- That inflation will not fall to the midpoint of the RBA’s 2%–3% target range until 2025. In July, trimmed mean inflation—a measure of core inflation that excludes items at the extremes—slowed to 3.8% year over year.
- The Reserve Bank of Australia to begin a gradual easing cycle next year, amid an anticipated weakening in both inflation and the labour market. Its policy rate is 4.35%.
China
Sluggish domestic demand highlights the risk that China’s target of 5% economic growth this year may not be met. Increased government loan issuance in August provides hope, but more of the same will likely be required in the months ahead. We expect:
- A 0.1 percentage point cut this year in the seven-day reverse repo rate, the policy rate of the People’s Bank of China. The policy rate stands at 1.7%. There may be further reductions in banks’ reserve requirement ratios as well.
- That China will still reach its economic growth target for 2024—provided that a sufficiently timely policy response occurs.
- Mild reflation this year, with headline inflation of 0.8% and core inflation, which excludes food and energy prices, of 1.0%. Producer prices fell on a year-over-year basis for the 23rd consecutive month in August.
Canada
On 4 September, for a third consecutive meeting, central bank policymakers cut their overnight interest rate target by 0.25 percentage point. We expect:
- The equivalent of one to two additional quarter-point rate cuts by the Bank of Canada this year, which would leave the overnight rate target in a range of 3.75%–4% at year-end.
- Below-trend economic growth of 1.25%–1.5% for the full year amid monetary policy restrictiveness that has been more potent than in the U.S.
- The year-over-year pace of core inflation to end 2024 in a range of 2.1%–2.4%.
- The unemployment rate will end the year around current levels—it stood at 6.6% in August—though risks skew higher as still-restrictive monetary policy could eat into demand and, ultimately, corporate profitability.
Euro area
On 12 September, the central bank announced the second cut to its policy interest rate of the new policy cycle that began in June. We expect:
- The European Central Bank to trim its deposit facility rate by another quarter-point in December, and a quarterly cadence of quarter-point cuts next year, which would leave the policy rate at 3.25% at year-end 2024 and 2.25% at year-end 2025. The balance of risks skews toward even greater easing.
- Year-over-year headline inflation to remain around 2.2% and core inflation to fall to about 2.6% at year-end, before reaching the ECB’s 2% target in 2025.
- The unemployment rate to end 2024 around current levels—it stood at a record-low 6.4% in July—though lower corporate profit margins skew risks to the upside.
- Full-year economic growth of only about 0.8%, as restrictive monetary and fiscal policy constrain activity.
United Kingdom
Although services inflation, pay growth, and GDP data have all recently undershot expectations, an 8-1, 19 September vote by central bank policymakers to maintain their 5% policy interest rate acknowledged that risks to resurgent inflation remained. We expect:
- The Bank of England (BOE) to cut the bank rate in November, with the policy rate ending 2024 at 4.75%, and quarterly 0.25-percentage-point cuts in 2025. Even greater easing seems more likely than less easing.
- Economic growth to moderate in the second half of the year, leaving full-year growth of 1.2%.
- Core inflation to end 2024 around 2.8% year over year—it stood at 3.6% in August—and to hit the BOE’s 2% target by the second half of 2025.
- The unemployment rate to end 2024 in a range of 4%–4.5%, with risks skewed to the upside. The rate stood at 4.1% in the May–July period.
Japan
Japan imported inflation through higher food and energy prices during the COVID-19 pandemic. The result has been a virtuous cycle of higher prices and even faster-rising wages in a country that had struggled through decades of little to no inflation and even deflation. We expect:
- Another interest rate policy increase by the Bank of Japan (BOJ), likely in the fourth quarter. Increasing real wages and inflation should give policymakers confidence as the country emerges from an era of stagnation.
- Full-year 2024 economic growth of about 0.2%, slightly above consensus, and a materially stronger 2025.
- Full-year headline and core inflation of about 2.5%, above the BOJ’s 2% inflation target, with a structural labour shortage continuing to exert upward pressure on wages.
Emerging markets
Services inflation remains sticky in most emerging markets, but that hasn’t stopped a cycle of interest rate cuts as broader inflation readings approach central bank targets. Since our economic survey last month, policy rates have been reduced by 0.25 percentage point in such markets as Chile, the Philippines, the Czech Republic, and Mexico.
A notable exception is Brazil, where the central bank raised its policy rate to 10.75% on 18 September, reversing a cutting cycle that began in August 2023. Brazil’s currency, the real, has depreciated by 13% against the U.S. dollar since the start of the year, through 17 September.
In Mexico, we expect:
- Another 0.5–1 percentage point of policy interest rate cuts in 2024, to a year-end range of 9.75%–10.25%, levels that would still be restrictive.
- The rate of core inflation to finish 2024 near the upper end of Banxico’s 2%–4% target range. It stood at 4% on a year-over-year basis in August.
- Full-year economic growth of 1.75%–2.25%. We’ll be watching for signs of restrictive policy rates weighing on consumption and fixed asset investment.
Notes: All investing is subject to risk, including the possible loss of the money you invest.
Investments in bonds are subject to interest rate, credit, and inflation risk.
Investments in stocks and bonds issued by non-U.S. companies are subject to risks including country/regional risk and currency risk. These risks are especially high in emerging markets.
IMPORTANT: The projections and other information generated by the Vanguard Capital Markets Model regarding the likelihood of various investment outcomes are hypothetical in nature, do not reflect actual investment results, and are not guarantees of future results. VCMM results will vary with each use and over time.
The VCMM projections are based on a statistical analysis of historical data. Future returns may behave differently from the historical patterns captured in the VCMM. More important, the VCMM may be underestimating extreme negative scenarios unobserved in the historical period on which the model estimation is based.
The Vanguard Capital Markets Model® is a proprietary financial simulation tool developed and maintained by Vanguard’s primary investment research and advice teams. The model forecasts distributions of future returns for a wide array of broad asset classes. Those asset classes include U.S. and international equity markets, several maturities of the U.S. Treasury and corporate fixed income markets, international fixed income markets, U.S. money markets, commodities, and certain alternative investment strategies. The theoretical and empirical foundation for the Vanguard Capital Markets Model is that the returns of various asset classes reflect the compensation investors require for bearing different types of systematic risk (beta). At the core of the model are estimates of the dynamic statistical relationship between risk factors and asset returns, obtained from statistical analysis based on available monthly financial and economic data from as early as 1960. Using a system of estimated equations, the model then applies a Monte Carlo simulation method to project the estimated interrelationships among risk factors and asset classes as well as uncertainty and randomness over time. The model generates a large set of simulated outcomes for each asset class over several time horizons. Forecasts are obtained by computing measures of central tendency in these simulations. Results produced by the tool will vary with each use and over time.
This article contains certain 'forward looking' statements. Forward looking statements, opinions and estimates provided in this article are based on assumptions and contingencies which are subject to change without notice, as are statements about market and industry trends, which are based on interpretations of current market conditions. Forward-looking statements including projections, indications or guidance on future earnings or financial position and estimates are provided as a general guide only and should not be relied upon as an indication or guarantee of future performance. There can be no assurance that actual outcomes will not differ materially from these statements. To the full extent permitted by law, Vanguard Investments Australia Ltd (ABN 72 072 881 086 AFSL 227263) and its directors, officers, employees, advisers, agents and intermediaries disclaim any obligation or undertaking to release any updates or revisions to the information to reflect any change in expectations or assumptions.
24 Sep 2024
By Vanguard
vanguard.com.au
28th-October-2024 |  Hawthorn Financial Planning Pty Ltd ABN 47 011 910 918